Introduction
Carbon-Free Europe (CFE) conducted a comprehensive modelling analysis on energy systems and the different pathways available to the European Union (EU) and the United Kingdom (UK) to fully decarbonize by 2050. While the EU has emerged as the largest international—nearly continent-wide—coalition of countries aiming for net-zero by the second half of the century and agreed on ambitious goals to mitigate climate change, it still needs to overcome various constraints to actualize its objectives fully. One of the most critical constraints is land use.
Factors like urban areas, environmentally protected ecosystems, nutrient-rich farmland, waterways, and carbon sinks are just a few examples of land restrictions impacting energy buildout. In line with their energy plans, it is imperative for both the EU and the UK to include a large share of renewable energy in their decarbonization pathways.
However, the location, size of land area, energy quality, and costs are all aspects that assessments like CFE’s modelling analysis must understand to accurately project the land available to build and scale renewable energy further.
Setting the Stage: Why the Fixation on Land Use?
Mitigation, or transitioning the globe to a net-zero emissions system, is essential for addressing the climate crisis. Adaptation, including resiliency and deterring further environmental degradation through sustainable development, is an equally important part of the puzzle. How Europe chooses to use its land for a combination of mitigation and adaptation strategies will be a significant factor in its ability to meet climate goals.
Europe is the second smallest continent, yet it consumes the highest percentage of land for human use—up to 80% for residential, infrastructure, and goods creation. This is in large part due to population density. In 2019 when the UK was still a member state, the total human population of the EU28 was around 514 million. As an already limited continent in terms of land use, Europe faces the daunting task of decarbonising its economy with minimal detrimental impact and some carbon-free technologies, like renewables, require more land than others. Therefore, the location, quantity, and type of clean energy deployed must be carefully considered in Europe’s energy planning and balanced among its other priorities, including natural resource management and ecosystem services. While there are many outliers not explored in this work that could impact Europe’s land-use decisions associated with its net-zero aspirations, our analysis acknowledges this balancing act by incorporating various assumptions related to land-use constraints for different clean energy technologies.
Geospatial Analysis of European Renewable Energy Potential
CFE’s modelling of net-zero pathways for the EU and UK, conducted jointly with Evolved Energy Research (EER), relied on a geospatial analysis to better identify land and marine areas available for wind and solar deployment in the EU27, Switzerland, Norway, and the UK.1 We commissioned Montara Mountain Energy to identify the technical renewable potential in this study area through an original GIS (Geographic Information System) assessment, which was then used in the energy systems model alongside resource quality and technology cost assumptions to estimate overall renewable resource potential.
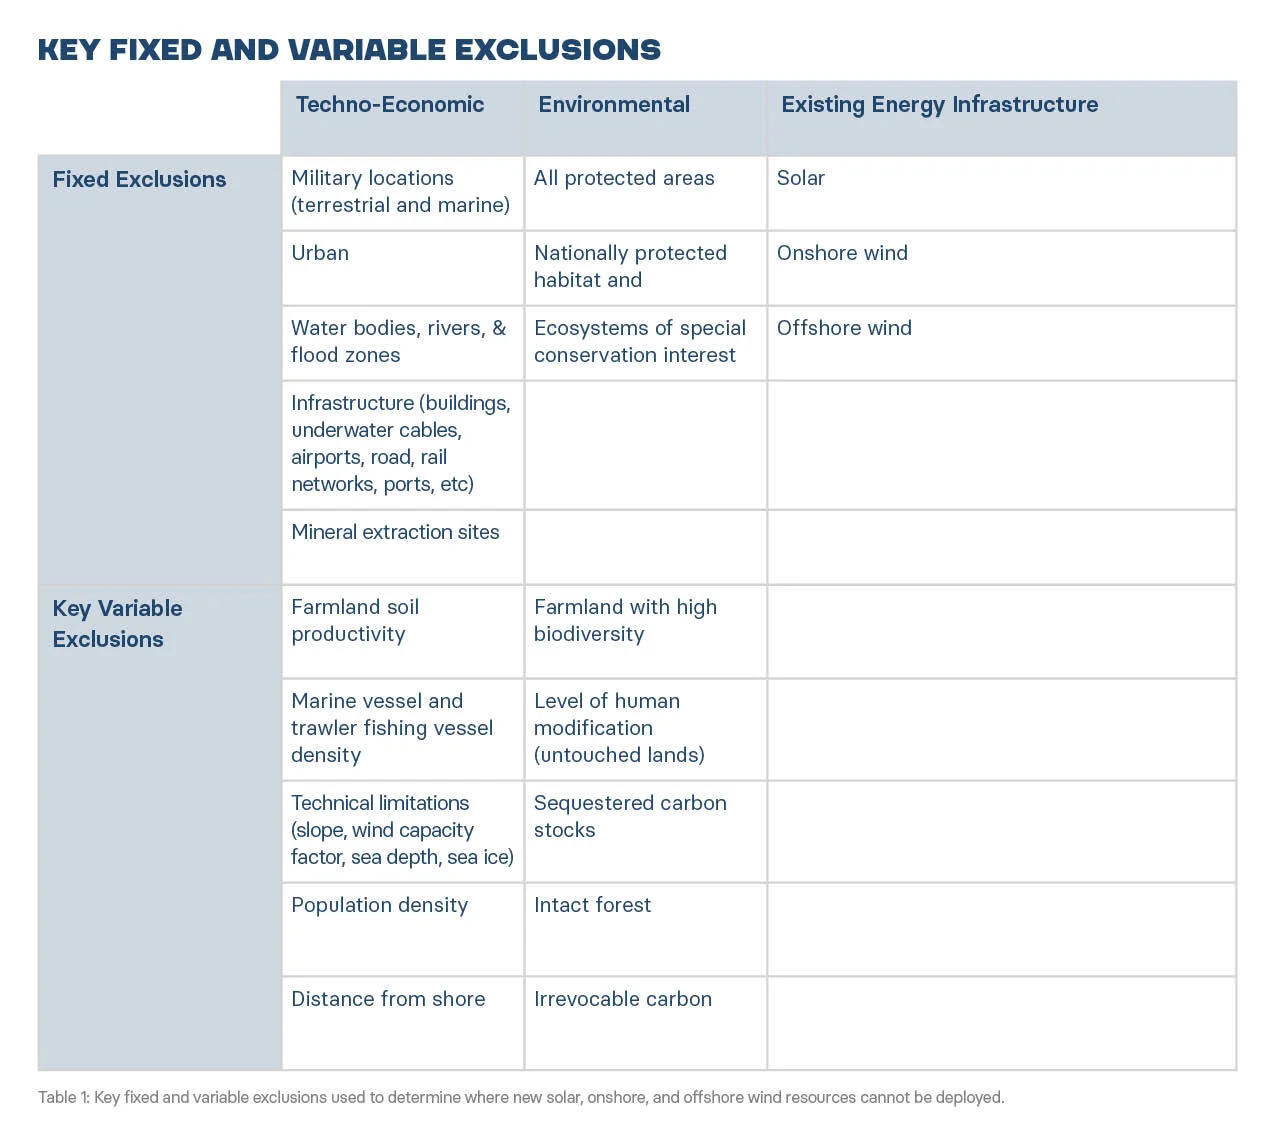
The GIS study explored geographic availability for potential new solar2 and wind energy by considering fixed and variable exclusions for land and marine use. Fixed exclusions define areas where renewables cannot be deployed and are the same for all scenarios. Whereas variable exclusions can be increased or decreased depending on assumptions. Overall, there are 32 exclusions, which can be categorised as either techno-economic, environmental, or existing energy infrastructure. See Table 1 to view some key fixed and variable exclusions.3
This geospatial analysis considered five scenarios with the same fixed exclusions but different levels of assumptions on the variable exclusions. For example, excluding 95% of highly productive farmland versus 100% of highly productive farmland.
The five scenarios are:
-
Base Restrictive Scenario: Assumes moderate or “baseline” variable exclusions
-
Max Restrictive Scenario: Assumes stricter levels of variable exclusions
-
High Conservation Scenario: Excludes all untouched lands and irrecoverable carbon4
-
Restrictive Farm: Excludes all agricultural lands
-
Max Commercially Feasible Scenario: Assumes more development on farmland, low human-modified lands, and irrevocable carbon. Assumes less development (compared to the Base Scenario) in unfeasible areas like densely populated areas, unsuitable slopes, low output for wind, and deep and icy waters
The GIS study used these layers and data to identify solar, onshore wind, and offshore wind Candidate Project Areas (CPA) for every scenario. Each CPA shows attribute data such as the size of the total area, capacity (GW), and annual generation (GWh). These findings were then applied to our energy systems model to build out renewable energy supply curves. Separate from the GIS analysis, the model also examined techno-economic restrictions on geothermal, rooftop PV, biomass, geologic sequestration, salt cavern hydrogen storage, and electricity interconnection potential.5 These final resource supply curves were used by the Regional Investment and Operations (RIO) model to help select the most practical areas for new development and optimise the energy supply of Europe through 2050. For the broader energy systems analysis and our key takeaways on constraints, we only used the Base and Max Restrictive scenarios as inputs. For more on the methodology, click here.
Key Takeaways
1. There’s only 7% of land available for new onshore wind and solar throughout the entire European study area in the Base scenario.
According to the Base scenario, the total land/marine area available for potential new wind and solar across the study area is 22%. Of that percentage, almost 67% is dedicated to offshore wind development. In comparison, the total land/marine area available for potential new wind and solar in the Max Restrictive scenario is 13%—of which nearly 76% is solely for offshore wind. Taking a step back and looking at this from a strictly terrestrial perspective for onshore wind and solar, the available land drastically decreases to be 7% of the total area identified for the Base scenario and 3% for the Max Restrictive Scenario. Highlighting Europe’s significant land-use constraints for new renewable buildout.

2. Out of the GIS study area, seven countries—Denmark, France, Ireland, Italy, Norway, Spain, and the UK—have the most significant technical renewable resource potential when just considering land-use and marine constraints.
Total renewable resource potential is calculated in our energy systems analysis considering land-use constraints, resource quality, and technology costs. Here, we are just referring to technical renewable resource potential in gigawatts (GW) from a land-use and marine constraints perspective and not yet factoring in resource quality or costs.
The countries with the highest technical resource potential in at least one of the renewable categories (solar, onshore wind, floating offshore wind, fixed offshore wind) are Denmark, France, Ireland, Italy, Norway, Spain, and the UK (Figure 1). Out of these seven countries,
- Three featured the highest solar capacity: France, Spain, and Italy
- Three stood out for onshore wind capacity: France, Norway, and Spain
- Four displayed the most offshore (fixed and floating) wind capacity: Denmark (fixed), the UK (fixed and floating), Ireland (floating), and Norway (floating)
- Three emphasised best overall wind and solar potential: France, Spain, the UK
Below is a breakdown for each of these countries under the Base scenario.
-
Denmark’s strongest resource is fixed offshore wind, with a total potential capacity of 172 GW.
-
France has an abundance of both solar and wind energy, making it one of the top three countries in our study. The total potential capacity is 1,143 GW for solar, 157 GW for onshore wind, and 228 GW for combined offshore wind.
-
Ireland’s greatest resource is floating offshore wind with a maximum potential capacity of 516 GW.
-
Italy’s solar is ranked third behind France and Spain, with a total capacity of 481 GW.
-
Norway’s combined wind resources show great potential with up to 171 GW of onshore wind capacity and 1,031 GW of offshore wind capacity.
-
Spain is another top country with opportune access to high quality resource potential for both wind and solar, with 1,113 GW of solar and 305 GW of onshore wind capacity.
-
The UK is also part of the trio determined by this analysis for the best wind and solar. It has 205 GW of solar and 887 GW of offshore wind.
Countries with abundant renewable resource potential will play important roles as energy suppliers to the rest of Europe, necessitating the buildout of transmission lines to deliver this electricity to load centres. However, all countries in this study area, even those fortunate enough to have significant renewable potential, should be mindful that firm, dispatchable energy6 and storage will still be required to achieve a 24/7 carbon-free power grid. For more on the obstacles related to a renewables-only energy mix, read our analysis on understanding risks in net-zero pathways for Europe.
3. On top of land-use constraints, the total potential capacity of new wind and solar energy decreases even further when factoring in economic restrictions.
In order for the energy systems model to choose the most technically and economically feasible land areas for new wind and solar, it uses this GIS analysis in tandem with its own cost supply curves. For example, if a prospective area has high transmission costs or lowerquality, less cost-effective renewable resources, the model is less likely to choose it.
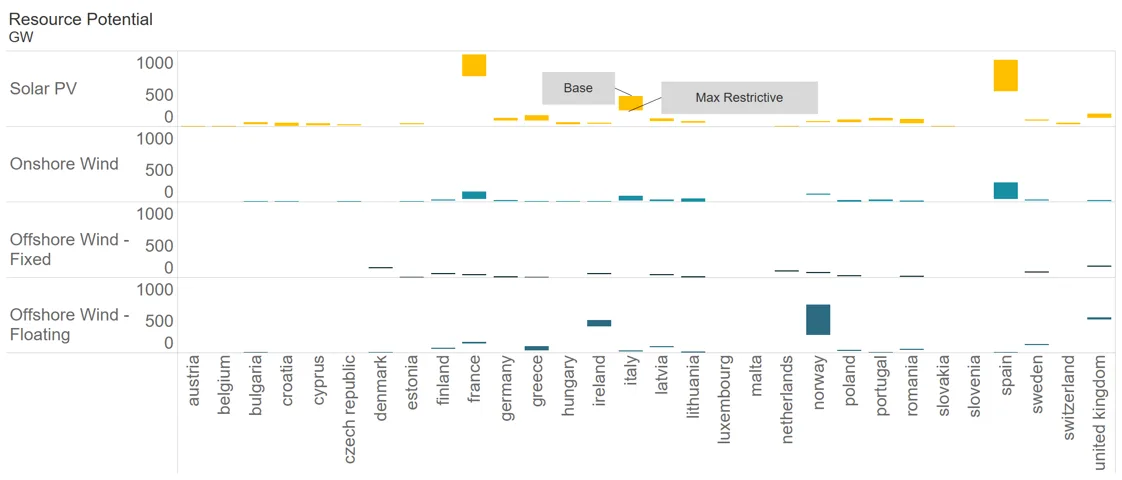
Figure 1: Comparison of the renewable resource technical potential identified in the GIS analysis per country for the Base and Max Restrictive scenarios.7
Model Deep Dive: Cost cutoffs and clustering analysis
The energy systems model categorises the Candidate Project Areas (CPAs) identified by the GIS study into bins by resource quality and transmission costs. In order to limit these bins to likely economic candidates, the model filtered out eligible CPAs by applying the following cutoffs:
- offshore wind CPAs with capacity factors less than 30% and/or transmission costs greater than $1200/kW
- onshore wind CPAs with transmission costs greater than $800/kW
- and solar CPAs with transmission costs greater than $600/kW8
Then, the remaining subset of screened CPAs was grouped into resource bins using a clustering analysis. Additionally, to account for the price of current renewables declining as technology advances, the model uses its built-in supply curves to make sophisticated estimations of the actual cost of energy over time.9 Therefore, the actual total available capacity for new wind and solar energy is likely lower than that identified in this GIS study (Figures 2 and 3), since renewable deployment is not only limited by land-use constraints but also economic ones.
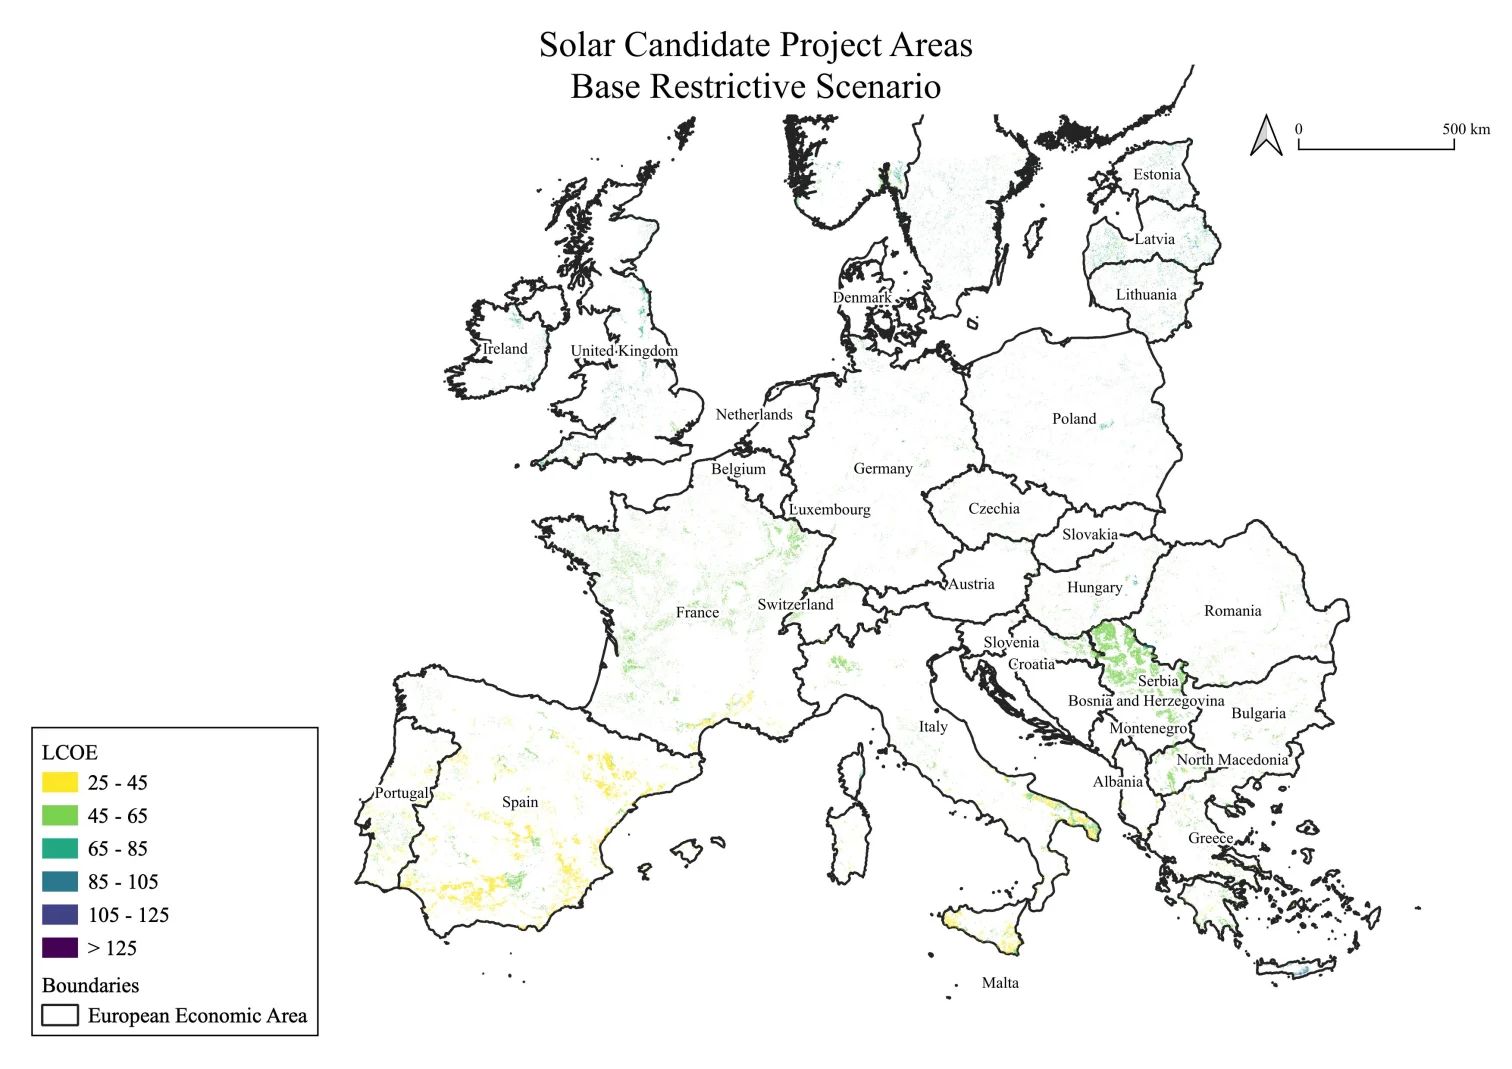
Here are three country examples from a wide-geographical distribution that exemplify this reduction for the potential capacity of solar in the Base scenario:
-
France
• Technical potential defined by GIS study: 1,144 GW
• Total potential after the model factors in economic cutoffs, quality, and competition factors: 163 GW (14% of technical potential)
-
Bulgaria
• Technical potential defined by GIS study: 62 GW
• Total potential after the model factors in economic cutoffs, quality, and competition factors: 10 GW (16% of technical potential)
-
Sweden
• Technical potential defined by GIS study: 119 GW
• Total potential after the model factors in economic cutoffs, quality, and competition factors: 3 GW (2% of technical potential)
As you can see, places where the quality of solar is very low, like Sweden, show the most reduction since it’s not as feasible in comparison to other carbon-free technologies. Overall, combining the Candidate Project Areas determined by the GIS assessment with the model’s technology cost assumptions provides a more complete picture of the total land available and economic constraints on renewables.
 Left Image Caption
 Right Image Caption
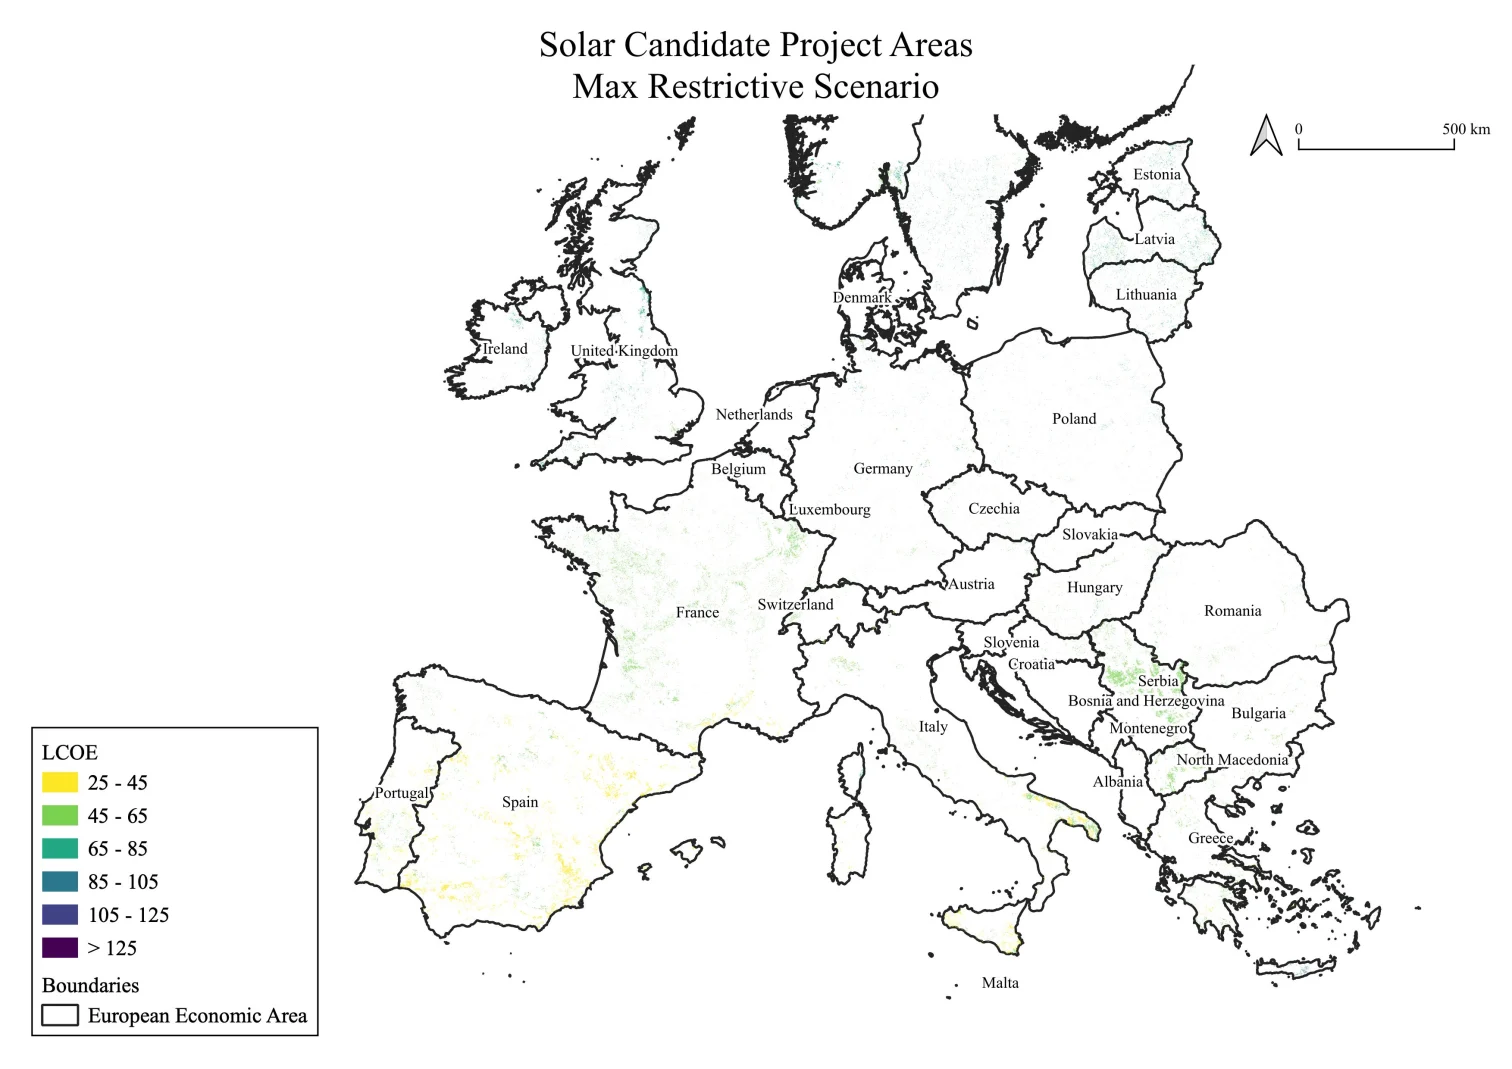
Figure 2: Prospective solar candidate project areas (CPAs) for the Base and Max Restrictive scenarios
 Left Image Caption
 Right Image Caption
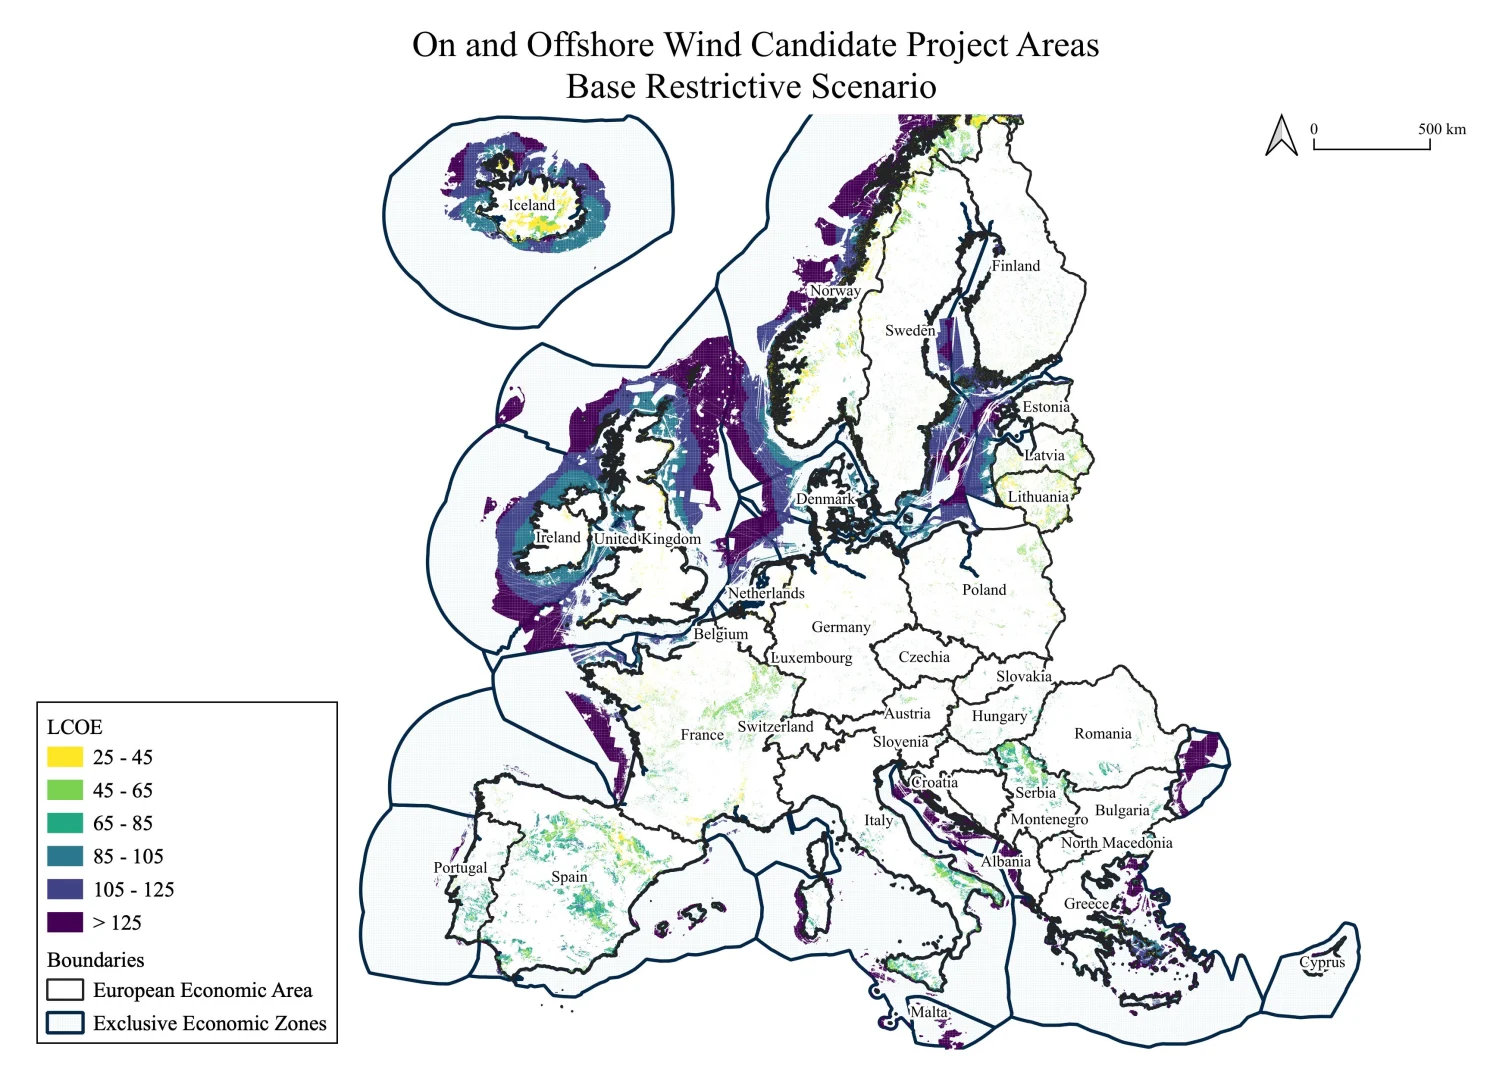
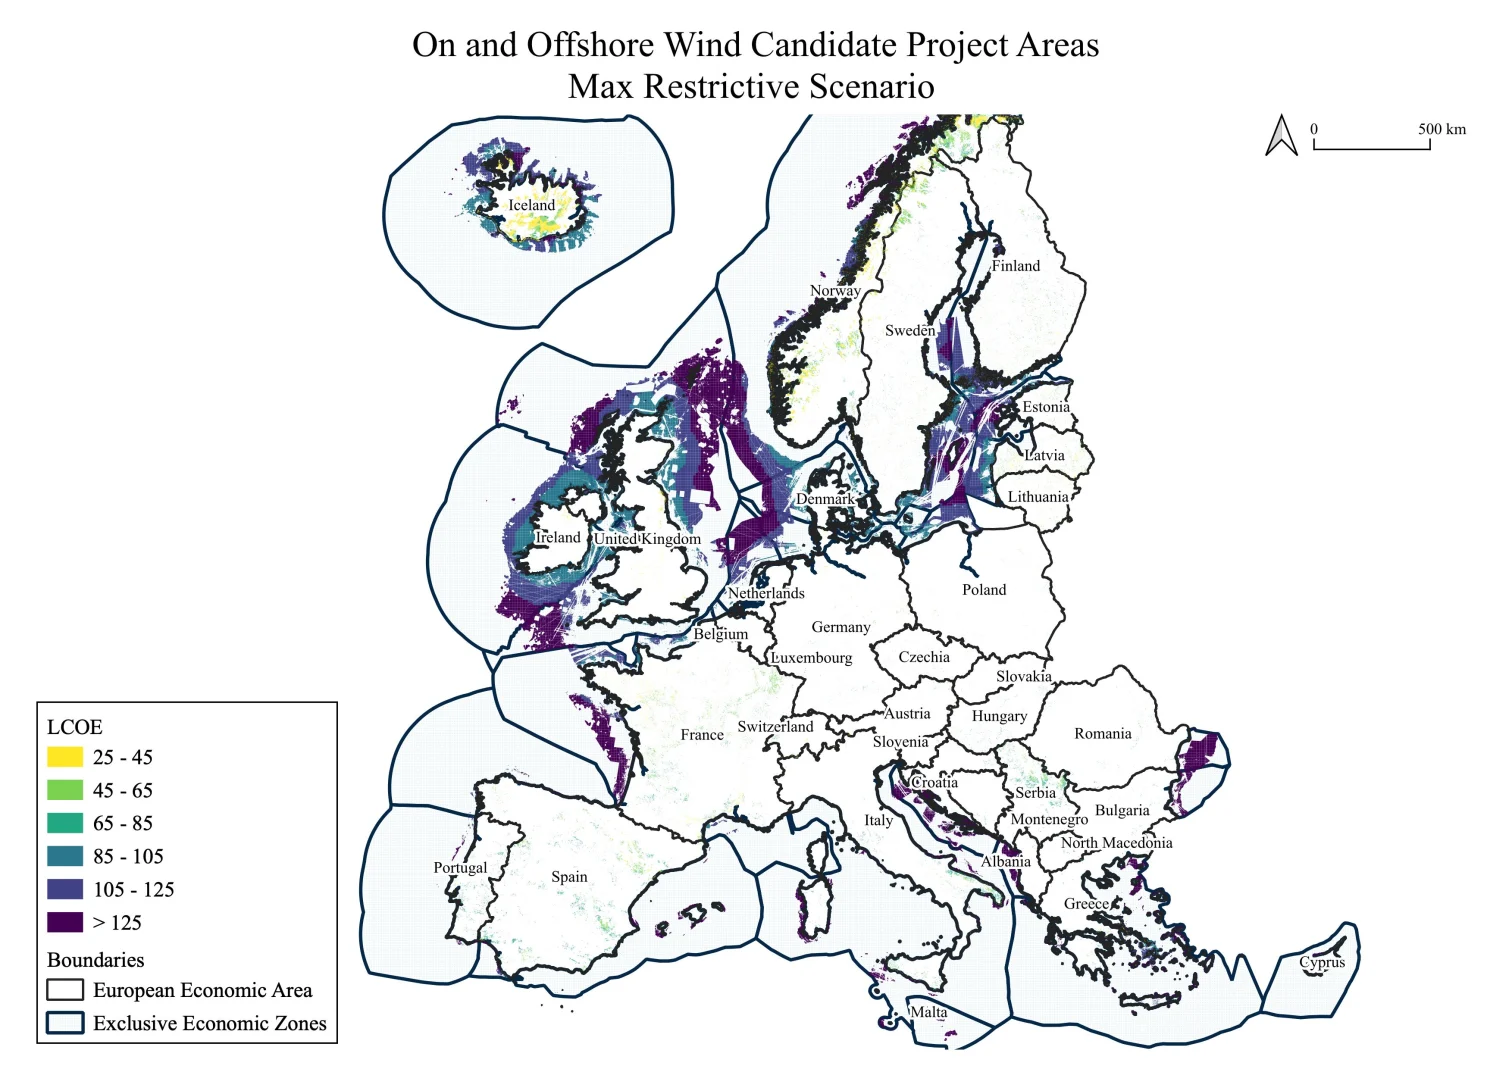
Figure 3: Prospective wind candidate project areas (CPAs) for the Base and Max Restrictive scenarios.
Deep-Dive: Agricultural Land Use
Farmland for agricultural or carbon sequestration purposes is a rising topic of concern in Europe. Excluding glaciers and barren land, in 2019, the world had 71% of habitable land, half of which was dedicated to agricultural processes. Furthermore, in the EU28 during 2000-2018, 78% of land consumption impacted agrarian zones. To ensure the model accurately considered these points when calculating total renewable resource potential for the different decarbonisation pathways, the GIS analysis limited farmland usage with high soil productivity and biodiversity factors at various levels within all five scenarios. The most stringent scenario in reference to farmland—Restrictive Farmland—excluded all agricultural land from siting new wind and solar. Figure 4 exemplifies the solar potential in the study area under this scenario. Since CFE’s energy systems analysis only relied on the Base and Max Restrictive scenarios, Table 3 compares the agricultural exclusion variables between the three scenarios. As demonstrated below, the Base and Max Restrictive scenarios conservatively incorporated farmland, and as a result, the model carefully accounted for agricultural land when creating the renewable supply curves in CFE’s model.

Figure 4: Prospective Solar CPA in the Restrictive Farmland Scenario.

Table 3: Comparison of Agricultural Exclusion Variables for solar and onshore wind in the Restrictive Farm, Base, and Max Restrictive Scenarios
Conclusion
Carbon-Free Europe offers a comprehensive analysis of pathways for the EU and UK to achieve net-zero emissions by incorporating a plethora of sources, like this GIS land use assessment, to account for many financial, technological, and resource limitations. Switching to clean energy demands a well-thought-out strategy to combat climate change’s near-term consequences without depleting the natural resource stocks essential for a carbon-free future and depriving the next generation of food, water, shelter, or wellbeing. This is why evaluating the fiscal, social, and environmental costs and tradeoffs for land use is so critical to climate and energy planning. Decarbonising the European economy will require ceasing the dependence on finite resources with volatile markets that are vulnerable to political manipulation. The lessons humanity learned throughout the historical overreliance on fossil fuels should be applied when considering clean energy alternatives. We cannot afford to fundamentally miss the point again for years to come. Fossil fuels are not only polluting, but they are exhaustible—and so is our land. Luckily, we have the scientific expertise, innovation, and necessary planning tools to change the scene. As Europe plans for a net-zero future, it is crucial to evaluate land-use constraints, and resource availability, quality, and cost for each energy type.